
Votelyra
The operating system for customer feedback: build surveys, collect responses through public links, and turn them into analytics and follow-up actions.
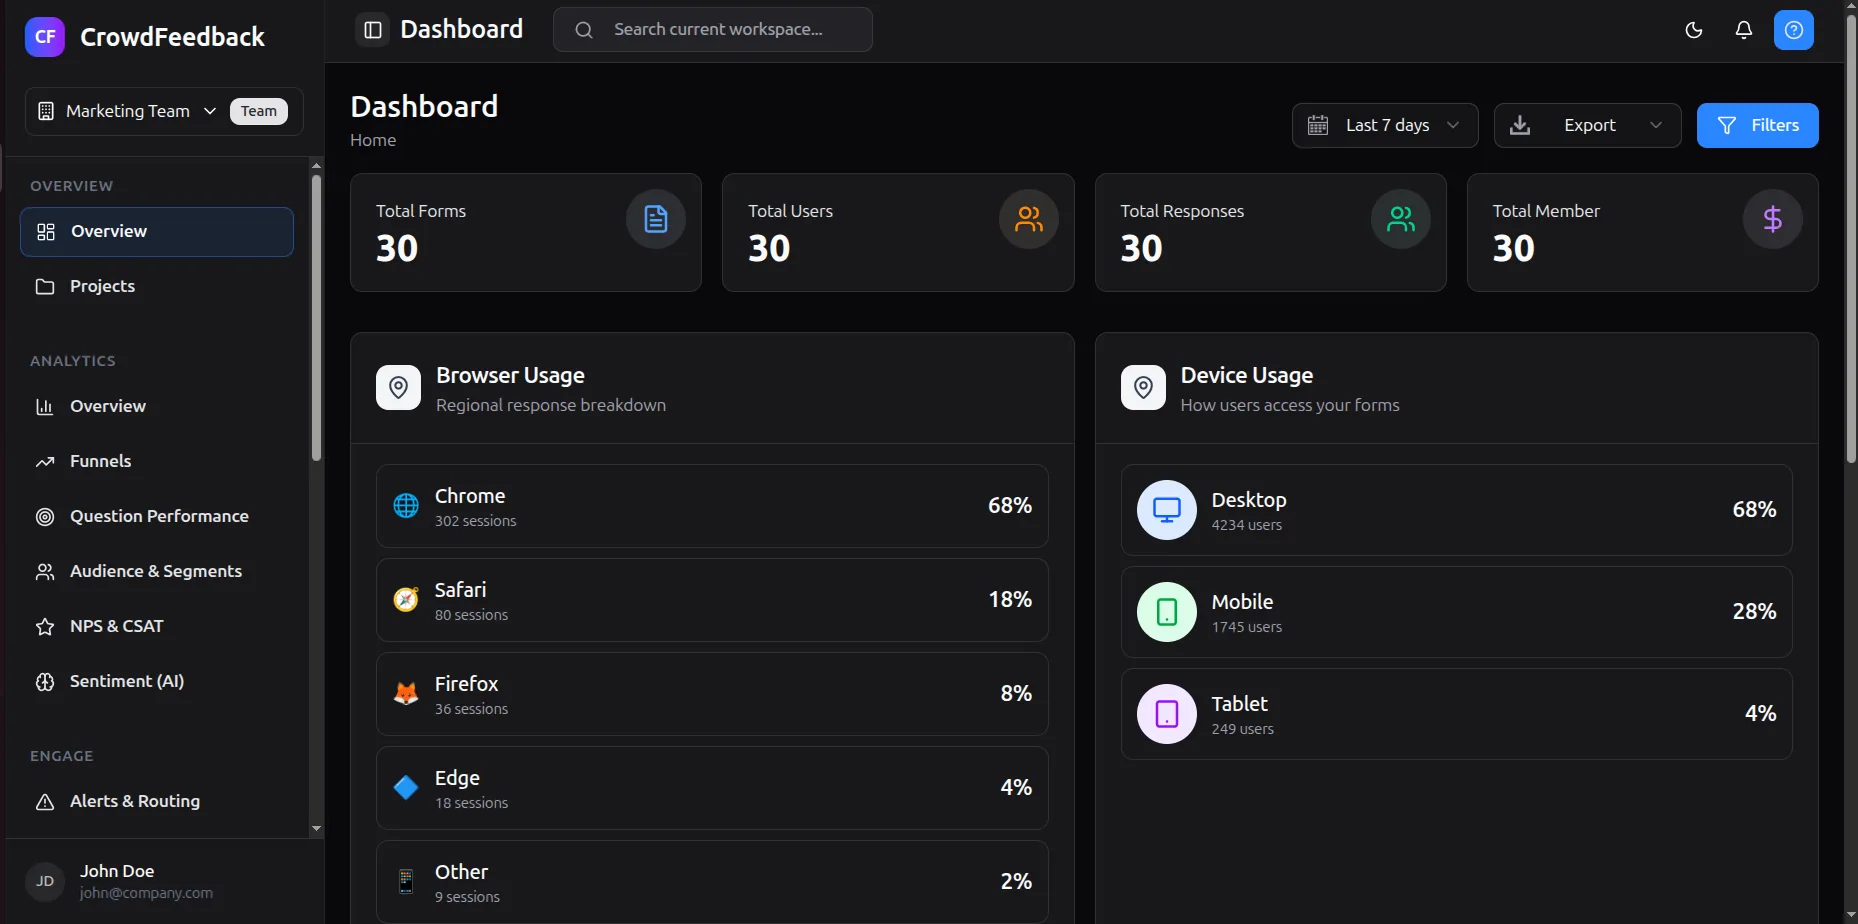
Project overview
Project overview
- Date:
- March 14, 2026
- Category:
- SaaS Platform
- Client:
- Own product
- Location:
- New York, USA
- Duration:
- 6-12 months
- Industry:
- SaaS
From survey to sentiment and follow-up in one platform
Votelyra brings survey building, response collection and analytics into one workspace, so teams can move from a question to a decision without switching tools.
Responses flow straight into funnel, NPS and sentiment views, and follow-ups close the loop with the people who answered, keeping every decision tied to real feedback.


Challenge
Challenge
Collecting feedback usually means one tool to build the survey, another to analyse the answers and a spreadsheet in between. Teams lose the thread between the question they asked and what they should do about the answer.
Most teams already had a survey tool, but the answers lived somewhere else. Exporting responses, cleaning them in a spreadsheet and building charts by hand meant insight arrived days after the feedback did.
Ownership was just as scattered. Product, marketing and customer success each ran their own surveys with their own logins, so nobody could see the full picture or reuse what another team had learned.
Acting on the answers was the weakest link. Following up with an unhappy respondent or alerting the right person about a low score depended on someone remembering to do it.
The platform had to close that loop: one place to ask, analyse and respond, with each team kept in its own workspace and its own permissions.
What success had to look like
- Build and share a survey without writing code
- Turn raw responses into audience, funnel, NPS and sentiment analytics
- Act on feedback with alerts, campaigns and follow-ups
- Let teams work in separate workspaces with their own permissions

Solution
Solution
Built as one typed stack: a Next.js frontend and a dedicated Fastify + tRPC API over PostgreSQL, so the builder, the response store, the analytics and the engagement tools share the same types end to end.
The builder, the response store and the analytics share one schema, so a question added in the builder shows up in every chart and export without a separate integration.
Engagement sits next to the data it acts on. A low NPS score can trigger an alert, and a follow-up email goes to the respondent from the same workspace that collected the answer.
Each team works in its own workspace with its own roles, and billing runs through Stripe so plans scale with the number of responses rather than the number of tools.
Keeping team data separate while sharing one database. Every query is scoped to a workspace and checked against the member's permissions in the API, so access control does not depend on what the UI chooses to hide. Billing follows the same rule: Stripe webhooks are verified by signature before a plan changes, and plan limits are enforced on the server.

Process
Process
Data model & API
Workspaces, members, projects, forms and responses behind a typed tRPC API.
Builder & public forms
The form builder and share-token links respondents open without signing in.
Analytics & data
Audience, funnels, NPS, per-question and sentiment views, plus datasets and segments.
Engage, teams & billing
Alerts, campaigns and follow-ups, member permissions, 2FA and Stripe billing.




Stack
Stack
- Next.js
- Vercel
- TypeScript
- React Hook Form
- Zod
- tRPC
- TanStack React Query
- Zustand
- Fastify
- AWS EC2
- PostgreSQL
- AWS RDS
- Drizzle ORM
- Redis
- Stripe
- PostHog
- AWS S3